[close window] | [C_STEP] |
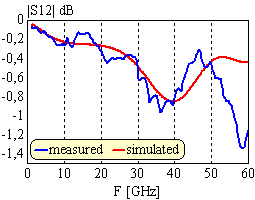
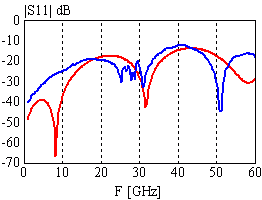
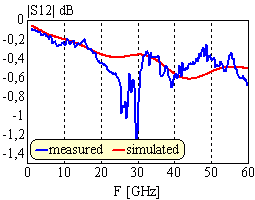
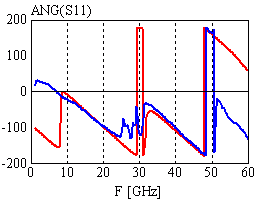
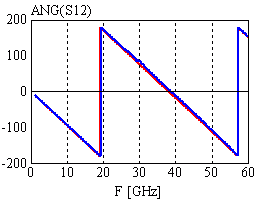
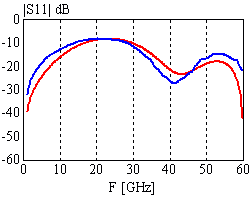
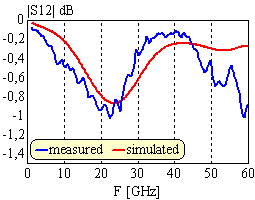
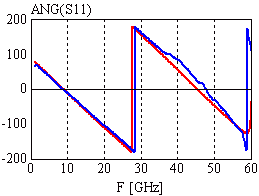
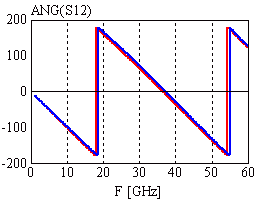
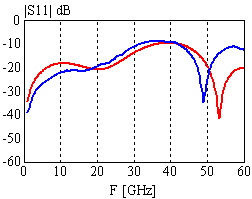
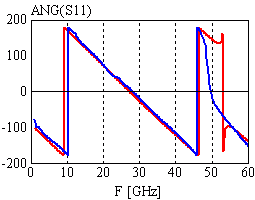
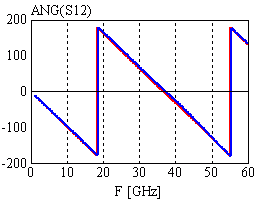
The difference between measurement and simulation is increasing with higher frequencies. That becomes obvious in the curve of |S11|. The explanation for this deviation is, that the FD simulator calculates the equivalent circuit elements utilizing the static effective permittivity. For coplanar line configurations, the effective permittivity increases with the frequency. Two examples (utilizing a spectral domain analysis):
50W1 CPW:ZL_static=48.4W, ZL(50GHz)=49.13W, ZL(60GHz)=49.13W40W5 CPW:
eeff_static=6.66, eeff(50GHz)=7.109, eeff(60GHz)=7.202
ZL_static=39.4W, ZL(50GHz)=40.43W, ZL(60GHz)=39.88W
eeff_static=6.66, eeff(50GHz)=7.04, eeff(60GHz)=7.106
Configuration: 50W1 lines at the ports, 40W5 CPW line (with d=240mm) in the middle; step parameter: SL=75mm; There is no step in the center line, but in the ground strips. total size: X=3700mm, Y=650mm |
|
|
Configuration: 50W1 lines at the ports, 50W4 (with d=293.5mm) CPW line in the middle (len=900mm); step parameter: SL=50mm; total size: X=3350mm, Y=650mm |
|
|
Configuration: 50W1 lines at the ports, 70W7 CPW line (with d=202mm) in the middle; step parameter: SL=75mm; total size: X=3700mm, Y=650mm |
|
|
[close window] | [C_STEP] |